Update: Luca Canali has written a newer version of Perfsheet (PerfSheet v4) and you can download it here. I am not updating/maintaining the old versions anymore (and Perfsheet v3 is only tested on up to Excel 2007) so I’d recommend to check out Luca’s PerfSheet v4.
Hi all,
I have been extremely busy over last couple of months, that’s why there haven’t been any blog entries (no, I haven’t ran out of good ideas ;-)
I just managed to find some time on a day-time 9-hour flight from Shanghai to Finland, thus here’s a blog entry about something what I had wanted to write about for long time… I’m talking about the PerfSheet tool I wrote a year ago and have been showing at few conferences already. It has been a great time saver for me over this year when working through performance data for troubleshooting or capacity planning tasks.
If you don’t want to read further through my comments, just download PerfSheet from </files/PerfSheet.zip> and see how it works yourself!
For others, let me give some history first:
- A client had some serious performance problems after an HBA driver upgrade on a weekend.
- DBAs were blamed first and they started looking into Statspack reports (as that was the only performance history data they had).
- Current Statspack reports didn’t show anything too extraordinary (as everybody knew this database was running quite non-optimally anyway).
- By that time, both storage and Unix admins “had done the healthchecks and everything looked fine”
- But something was definitely different today as the end user response times were much worse.
- (This is a case where we didn’t care about general inefficiency of the application as this is what the application had been like all the time. Instead of systematically starting optimizing the database we just had to find what had gone wrong over the weekend and fix it. In other words, something had got F-ed up over the weekend and we needed to un-F it ;).
- Thus the troubleshooters (including me) started comparing the “current” statspack reports with previous ones to see what were the main differences in wait and load profiles were.
- But it wasn’t as easy as just taking last days snapshot from the same time as the load & wait profile of that system was fluctuating anyway as some heavily parallel batch jobs started and finished (at different times).
- Based on the statspack numbers the DBAs suspected that there was something wrong with IO configuration (especially as there had been a HBA driver upgrade over the weekend)
- Taking tens of 50-page statspack reports to a fingerpointing meeting with SAs, storage admins, high level directors etc didn’t work well…
Then I thought to visualize the numbers in Excel to get our point (and proof) through better.
Running Statspack reports manually and pasting numbers from there into Excel very boring, slow and error prone task. I actually started doing this but after 10 (painful) minutes I thought, heck, why am I doing all this manually?
This is how PerfSheet was born. I wrote the first version in couple of hours and it just ran an analytic query (downloaded the query from Tim Gorman’s site) against statspack repository. After fetching the SQL resultset to Excel, the sheet also automatically displayed the results in a graph (so we could refresh the graph after querying different stats out of statspack repository).
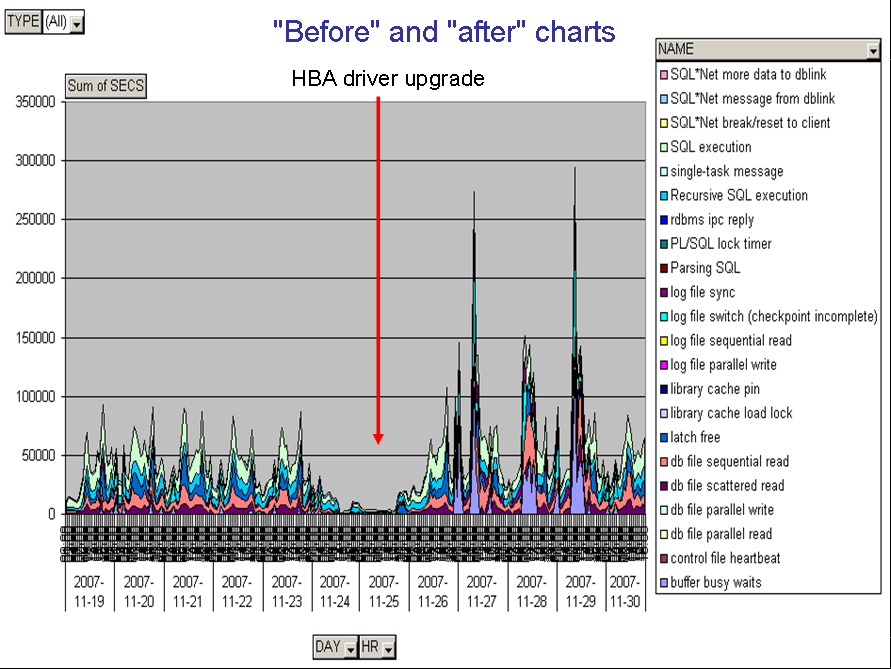
And armed with the wait profile graph above we were able to show hard evidence in a simple package (as opposed to tens of statspack reports) at the next meeting with storage and Unix teams. It’s very hard to argue with evidence like that, especially if managers are involved :) It’s much easier to discard a DBA with 500 pages of statspack reports blabbering about Oracle wait interface than someone who shows a visual overview of database health.
This led the Unix SAs to do another healthcheck and this time they found out that one of the two HBAs had been left deactivated after the driver upgrade. After the HBA was activated (online), the performance went back to normal.
So, sometimes, especially if multiple teams are involved in troubleshooting a sudden peformance problem (and there’s negative fingerpointing and protectionism going on), it’s hard to beat historical performance visualization. Instead of going through tens of pages of raw numbers you can just visualize that data and see if your eye catches a sudden change, trend or outlier.
And this leads me to version 2.0 (beta) of PerfSheet.
It allows you to do ad-hoc visualization of any SQL resultset. Excel runs your specified SQL statement, fetches data onto a worksheet and shows the results on a PivotChart. I have actually written only few lines of code to glue Excel’s SQL execution, data fetching and visualization modules together for convenience, Excel itself does most of the work.
When you open up the PerfSheet.xls, just fill in the connect details on the first page and click “Show me” and see what I mean (note that some queries do query v$active_session_history and DBA_HIST tables so make sure you have the proper licenses for querying these views).
Once the graph is displayed you can even drag and drop the data fields around into different axis to get a different breakdown of the statistics. Try it out and you’ll love it :)
Also, you can hover your mouse over some data element to get its description, as I’ve done here to see a SQLID matching an ASH sample on an ASH query:
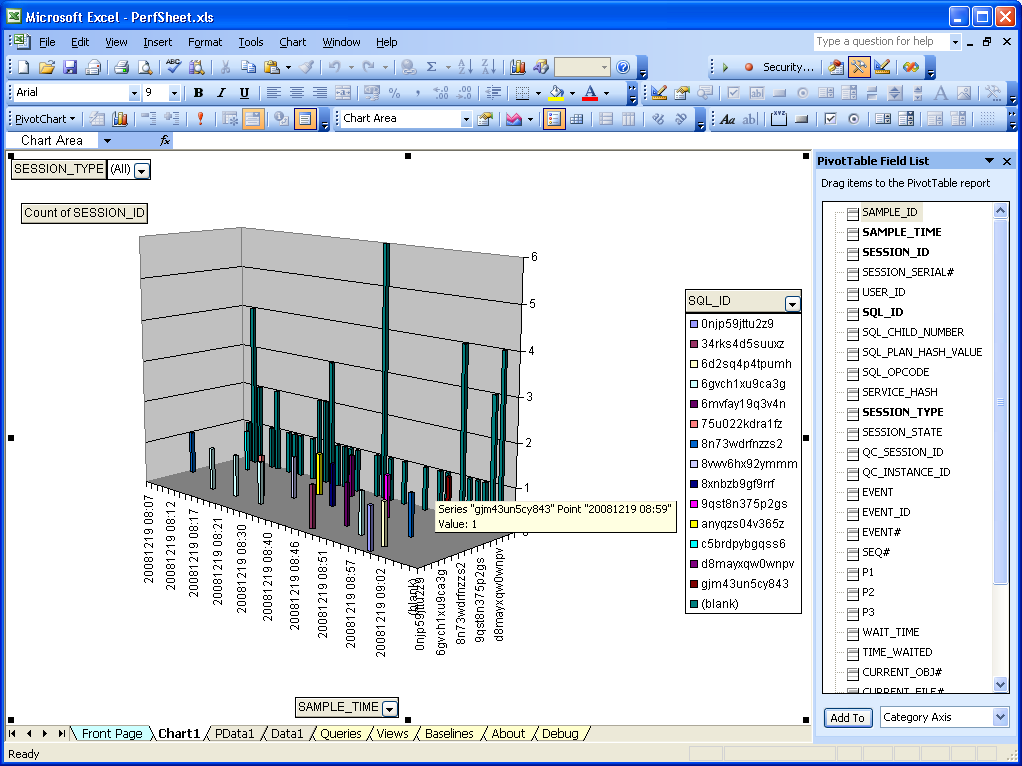
As a next step, just navigate around at the Queries, Views and Help tabs and read the comments at column headers on how to define your own queries and visualization views. And if it doesn’t work, let me know.
Also, one more important thing. I used Excel for data fetching and visualization and I uset it on purpose. I haven’t seen a corporation yet where there is no Windows workstation and Excel available. Often I hear people saying that I should just use some Perl/Python/TCL/Java module or toolkit suth RRD etc as then you can put your graphs into web and “everybody has a web browser”.
I say that the mentioned technologies are for entirely different purpose. Yes, everybody does have a web browser, but In a corporation it’s not easy at all to get a (virtual) webserver for your purpose (and get all the software downloaded, configured and installed). When you have a serious production problem to troubleshoot, you don’t want to start installing and configuring webservers :)
The webserver approach is good for proactive, predetermined visualization, e.g. you know what you want to monitor and you make that data available in the intranet. But PerfSheet is perfect (thus the name :) for ad-hoc performance visualization of any SQL resultset on pretty much any corporate workstation.
So, Merry Christmas and happy visualization in the next year ;)
