Here’s a treat for the hard-core Oracle performance geeks out there – I’m releasing a cool, but still experimental script for ASH (or poor-man’s ASH)-based wait event analysis, which should add a whole new dimension into ASH based performance analysis. It doesn’t replace any of the existing ASH analysis techniques, but should bring the relationships between Oracle sessions in complex wait chains out to bright daylight much easier than before.
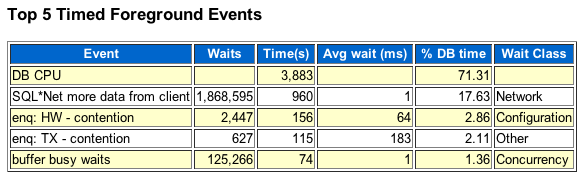
You all are familiar with the AWR/Statspack timed event summary below:
Similar breakdown can be gotten by just aggregating ASH samples by the wait event:
SQL> @ash/dashtop session_state,event 1=1 "TIMESTAMP'2013-09-09 21:00:00'" "TIMESTAMP'2013-09-09 22:00:00'"

%This  SESSION EVENT                                                            TotalSeconds        CPU   User I/O Application Concurrency     Commit Configuration    Cluster       Idle    Network System I/O  Scheduler Administrative   Queueing      Other MIN(SAMPLE_TIME)                                                            MAX(SAMPLE_TIME)
------ ------- ---------------------------------------------------------------- ------------ ---------- ---------- ----------- ----------- ---------- ------------- ---------- ---------- ---------- ---------- ---------- -------------- ---------- ---------- --------------------------------------------------------------------------- ---------------------------------------------------------------------------
  68%  ON CPU                                                                          25610      25610          0           0           0          0             0          0          0          0          0          0              0          0          0 09-SEP-13 09.00.01.468 PM                                                   09-SEP-13 09.59.58.059 PM
  14%  WAITING SQL*Net more data from client                                            5380          0          0           0           0          0             0          0          0       5380          0          0              0          0          0 09-SEP-13 09.00.01.468 PM                                                   09-SEP-13 09.59.58.059 PM
   6%  WAITING enq: HW - contention                                                     2260          0          0           0           0          0          2260          0          0          0          0          0              0          0          0 09-SEP-13 09.04.41.893 PM                                                   09-SEP-13 09.56.07.626 PM
   3%  WAITING log file parallel write                                                  1090          0          0           0           0          0             0          0          0          0       1090          0              0          0          0 09-SEP-13 09.00.11.478 PM                                                   09-SEP-13 09.59.58.059 PM
   2%  WAITING db file parallel write                                                    730          0          0           0           0          0             0          0          0          0        730          0              0          0          0 09-SEP-13 09.01.11.568 PM                                                   09-SEP-13 09.59.48.049 PM
   2%  WAITING enq: TX - contention                                                      600          0          0           0           0          0             0          0          0          0          0          0              0          0        600 09-SEP-13 09.04.41.893 PM                                                   09-SEP-13 09.48.16.695 PM
   1%  WAITING buffer busy waits                                                         560          0          0           0         560          0             0          0          0          0          0          0              0          0          0 09-SEP-13 09.10.02.492 PM                                                   09-SEP-13 09.56.07.626 PM
   1%  WAITING log file switch completion                                                420          0          0           0           0          0           420          0          0          0          0          0              0          0          0 09-SEP-13 09.47.16.562 PM                                                   09-SEP-13 09.47.16.562 PM
   1%  WAITING latch: redo allocation                                                    330          0          0           0           0          0             0          0          0          0          0          0              0          0        330 09-SEP-13 09.04.41.893 PM                                                   09-SEP-13 09.53.27.307 PM
...
The abovementioned output has one shortcoming in a multiuser (database) system – not all wait events are simple, where a session waits for OS to complete some self-contained operation (like an IO request). Often a session waits for another session (who holds some lock) or some background process who needs to complete some task before our session can continue. That other session may wait for a yet another session due to some other lock. The other session itself waits for a yet another one, thanks to some buffer pin (buffer busy wait). The session who holds the buffer pin, may itself be waiting for LGWR, who may in turn wait for DBWR etc… You get the point – sometimes we have a bunch of sessions, waiting for each other in a chain.
The V$WAIT_CHAINS view introduced in Oracle 11g is capable of showing such chains of waiting sessions – however it is designed to diagnose relatively long-lasting hangs, not performance problems and short (but non-trivial) contention. Usually the DIAG process, who’s responsible for walking through the chains and populating V$WAIT_CHAINS, doesn’t kick in after a few seconds of ongoing session waits and the V$WAIT_CHAINS view may be mostly empty – so we need something different for performance analysis.
Now, it is possible to pick one of the waiting sessions and use the blocking_session column to look up the blocking SID – and see what that session was doing and so on. I used to do this somewhat manually, but realized that a simple CONNECT BY loop with some ASH sample iteration trickery can easily give us complex wait chain signature & hierarchy information.
So, I am presenting to you my new ash_wait_chains.sql script! (Woo-hoo!). It’s actually completely experimental right now, I’m not fully sure whether it returns correct results and some of the planned syntax isn’t implemented yet :) EXPERIMENTAL, not even beta :) And no RAC nor DBA_HIST ASH support yet.
In the example below, I am running the script with parameter event2, which is just really a pseudocolumn on ASH view (look in the script). So it shows just the wait events of the sessions involved in a chain. You can use any ASH column there for extra information, like program, module, sql_opname etc:
SQL> @ash/ash_wait_chains event2 1=1 sysdate-1 sysdate

-- ASH Wait Chain Signature script v0.1 EXPERIMENTAL by Tanel Poder (  )

%This     SECONDS WAIT_CHAIN
------ ---------- ------------------------------------------------------------------------------------------
  60%       77995 -> ON CPU
  10%       12642 -> cell single block physical read
   9%       11515 -> SQL*Net more data from client
   2%        3081 -> log file parallel write
   2%        3073 -> enq: HW - contention  -> cell smart file creation
   2%        2723 -> enq: HW - contention  -> buffer busy waits  -> cell smart file creation
   2%        2098 -> cell smart table scan
   1%        1817 -> db file parallel write
   1%        1375 -> latch: redo allocation  -> ON CPU
   1%        1023 -> enq: TX - contention  -> buffer busy waits  -> cell smart file creation
   1%         868 -> block change tracking buffer space
   1%         780 -> enq: TX - contention  -> buffer busy waits  -> ASM file metadata operation
   1%         773 -> latch: redo allocation
   1%         698 -> enq: TX - contention  -> buffer busy waits  -> DFS lock handle
   0%         529 -> enq: TX - contention  -> buffer busy waits  -> control file parallel write
   0%         418 -> enq: HW - contention  -> buffer busy waits  -> DFS lock handle
What does the above output tell us? I have highlighted 3 rows above, let’s say that we want to get more insight about the enq: HW – contention wait event. The ash_wait_chains script breaks down the wait events by the “complex” wait chain signature (who’s waiting for whom), instead of just the single wait event name! You read the wait chain information from left to right. For example 2% of total response time (3073 seconds) in the analysed ASH dataset was spent by a session, who was waiting for a HW enqueue, which was held by another session, who itself happened to be waiting for the cell smart file creation wait event. The rightmost wait event is the “ultimate blocker”. Unfortunately ASH doesn’t capture idle sessions by default (an idle session may still be holding a lock and blocking others), so in the current version (0.1) of this script, the idle blockers are missing from the output. You can still manually detect a missing / idle session as we’ll see later on.
So, this script allows you to break down the ASH wait data not just by a single, “scalar” wait event, but all wait events (and other attributes) of a whole chain of waiting sessions – revealing hierarchy and dependency information in your bottleneck! Especially when looking into the chains involving various background processes, we gain interesting insight into the process flow in an Oracle instance.
As you can add any ASH column to the output (check the script, it’s not too long), let’s add the program info too, so we’d know what kind of sessions were involved in the complex waits (I have removed a bunch of less interesting lines from the output and have highlighted some interesting ones (again, read the chain of waiters from left to right):
SQL> @ash/ash_wait_chains program2||event2 1=1 sysdate-1 sysdate

-- ASH Wait Chain Signature script v0.1 EXPERIMENTAL by Tanel Poder (  )

%This     SECONDS WAIT_CHAIN
------ ---------- -----------------------------------------------------------------------------------------------------------------------------------------------
  56%       73427 -> (JDBC Thin Client) ON CPU
   9%       11513 -> (JDBC Thin Client) SQL*Net more data from client
   9%       11402 -> (oracle@enkxndbnn.enkitec.com (Jnnn)) cell single block physical read
   2%        3081 -> (LGWR) log file parallel write
   2%        3073 -> (JDBC Thin Client) enq: HW - contention  -> (JDBC Thin Client) cell smart file creation
   2%        2300 -> (JDBC Thin Client) enq: HW - contention  -> (JDBC Thin Client) buffer busy waits  -> (JDBC Thin Client) cell smart file creation
...
   1%        1356 -> (JDBC Thin Client) latch: redo allocation  -> (JDBC Thin Client) ON CPU
   1%        1199 -> (JDBC Thin Client) cell single block physical read
   1%        1023 -> (JDBC Thin Client) enq: TX - contention  -> (JDBC Thin Client) buffer busy waits  -> (Wnnn) cell smart file creation
   1%         881 -> (CTWR) ON CPU
   1%         858 -> (JDBC Thin Client) block change tracking buffer space
   1%         780 -> (JDBC Thin Client) enq: TX - contention  -> (JDBC Thin Client) buffer busy waits  -> (Wnnn) ASM file metadata operation
   1%         766 -> (JDBC Thin Client) latch: redo allocation
   1%         698 -> (JDBC Thin Client) enq: TX - contention  -> (JDBC Thin Client) buffer busy waits  -> (Wnnn) DFS lock handle
   0%         529 -> (JDBC Thin Client) enq: TX - contention  -> (JDBC Thin Client) buffer busy waits  -> (Wnnn) control file parallel write
   0%         423 -> (JDBC Thin Client) enq: HW - contention  -> (JDBC Thin Client) buffer busy waits  -> (Wnnn) cell smart file creation
   0%         418 -> (JDBC Thin Client) enq: HW - contention  -> (JDBC Thin Client) buffer busy waits  -> (Wnnn) ASM file metadata operation
   0%         418 -> (JDBC Thin Client) enq: HW - contention  -> (JDBC Thin Client) buffer busy waits  -> (Wnnn) DFS lock handle
...
   0%          25 -> (JDBC Thin Client) gcs drm freeze in enter server mode  -> (LMON) ges lms sync during dynamic remastering and reconfig  -> (LMSn) ON CPU
   0%          25 -> (JDBC Thin Client) enq: HW - contention  -> (JDBC Thin Client) buffer busy waits  -> (Wnnn) DFS lock handle  -> (DBWn) db file parallel write
...
   0%          18 -> (JDBC Thin Client) enq: HW - contention  -> (JDBC Thin Client) CSS operation: action
   0%          18 -> (LMON) control file sequential read
   0%          17 -> (LMSn) ON CPU
   0%          17 -> (JDBC Thin Client) buffer busy waits  -> (Wnnn) cell smart file creation
   0%          16 -> (JDBC Thin Client) enq: FB - contention  -> (JDBC Thin Client) gcs drm freeze in enter server mode  -> (LMON) ges lms sync during dynamic remastering and reconfig  -> (LMSn) ON CPU
...
   0%           3 -> (JDBC Thin Client) enq: HW - contention  -> (JDBC Thin Client) buffer busy waits  -> (JDBC Thin Client) CSS operation: action
   0%           3 -> (JDBC Thin Client) buffer busy waits  -> (JDBC Thin Client) latch: redo allocation  -> (JDBC Thin Client) ON CPU
...
   0%           1 -> (JDBC Thin Client) enq: TX - contention  -> (JDBC Thin Client) enq: TX - contention  -> (JDBC Thin Client) buffer busy waits  -> (Wnnn) ASM file metadata operation
   0%           1 -> (Wnnn) buffer busy waits  -> (JDBC Thin Client) block change tracking buffer space
...
In a different example, when adding the sql_opname column (11.2+) we can also display the type of SQL command that ended up waiting (like UPDATE, DELETE, LOCK etc) which is useful for lock contention analysis:
SQL> @ash/ash_wait_chains sql_opname||':'||event2 1=1 sysdate-1/24/60 sysdate

-- Display ASH Wait Chain Signatures script v0.1 EXPERIMENTAL by Tanel Poder (  )

%This     SECONDS WAIT_CHAIN
------ ---------- ------------------------------------------------------------------------------------------------------------------------------------------------------
  18%          45 -> LOCK TABLE:enq: TM - contention  -> LOCK TABLE:enq: TM - contention
  18%          45 -> LOCK TABLE:enq: TM - contention
  17%          42 -> DELETE:enq: TM - contention  -> LOCK TABLE:enq: TM - contention
  10%          25 -> SELECT:direct path read
   6%          14 -> TRUNCATE TABLE:enq: TM - contention
   5%          13 -> SELECT:ON CPU
   2%           5 -> LOCK TABLE:enq: TM - contention  -> SELECT:ON CPU
   2%           5 -> TRUNCATE TABLE:enq: TM - contention  -> SELECT:ON CPU
   2%           5 -> SELECT:db file scattered read
   2%           5 -> DELETE:enq: TM - contention  -> LOCK TABLE:enq: TM - contention  -> SELECT:db file scattered read
   2%           5 -> DELETE:enq: TM - contention  -> LOCK TABLE:enq: TM - contention  -> SELECT:ON CPU
   2%           5 -> LOCK TABLE:enq: TM - contention  -> LOCK TABLE:enq: TM - contention  -> SELECT:db file scattered read
   2%           5 -> TRUNCATE TABLE:enq: TM - contention  -> SELECT:db file scattered read
   2%           5 -> LOCK TABLE:enq: TM - contention  -> SELECT:db file scattered read
   2%           5 -> LOCK TABLE:enq: TM - contention  -> LOCK TABLE:enq: TM - contention  -> SELECT:ON CPU
   2%           4 -> TRUNCATE TABLE:enq: TM - contention  -> SELECT:direct path read
   2%           4 -> LOCK TABLE:enq: TM - contention  -> LOCK TABLE:enq: TM - contention  -> SELECT:direct path read
   2%           4 -> DELETE:enq: TM - contention  -> LOCK TABLE:enq: TM - contention  -> SELECT:direct path read
   2%           4 -> LOCK TABLE:enq: TM - contention  -> SELECT:direct path read
This is an experimental script and has some issues and shortcomings right now. For example, if the final blocking session itself was idle during the sampling, like the blue highlighted line above, then the blocking session is not shown there – as ASH doesn’t capture idle session samples. Also it doesn’t work for RAC right now (and this might be problematic as in RAC the blocking_session info for global wait events may not immediately be resolved either, unlike in the instance-local cases). And I will try to find better example cases illustrating the use of this technique (you’re welcome to send me your output from busy databases for analysis :)
I have written a Part 2 for this article too.
