In my previous post ( Advanced Oracle Troubleshooting Guide – Part 11: Complex Wait Chain Signature Analysis with ash_wait_chains.sql ) I introduced an experimental script for analysing performance from “top ASH wait chains” perspective. The early version (0.1) of the script didn’t have the ability to select a specific user (session), SQL or module/action performance data for analysis. I just hadn’t figured out how to write the SQL for this (as the blocking sessions could come from any user). So it turns out it was just matter of using “START WITH
Download the latest version of:
- ash_wait_chains.sql (ASH wait chain analysis with the V$ACTIVE_SESSION_HISTORY data)
- dash_wait_chains.sql (ASH wait chain analysis with the DBA_HIST_ACTIVE_SESS_HISTORY data)
So, now the parameter #2 is actually used, for example the username=’TANEL’ syntax below means that we will list only Tanel’s sessions as top-level waiters in the report, but of course as a Tanel’s session may be blocked by any other user’s session, this where clause doesn’t restrict displaying any of the blockers, regardless of their username:
@ash_wait_chains program2||event2 username='TANEL' sysdate-1/24 sysdate
I have added one more improvement, which you’ll see in a moment. So here’s a problem case. I was performance testing parallel loading of a 1TB “table” from Hadoop to Oracle (on Exadata). I was using external tables (with the Hadoop SQL Connector) and here’s the SQL Monitor report’s activity chart:
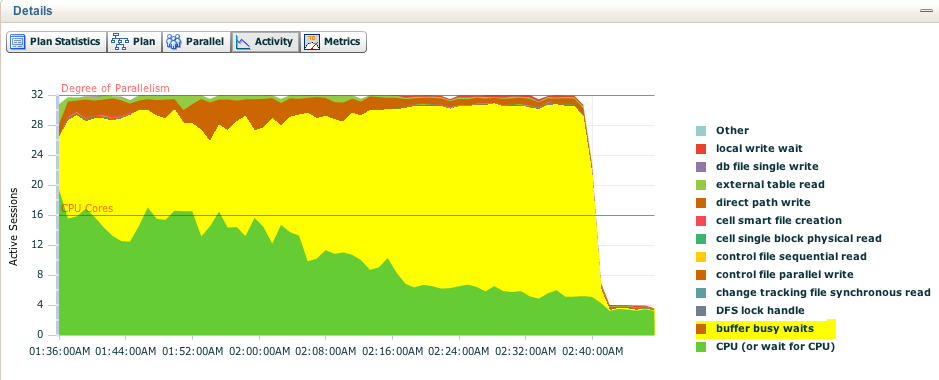
A large part of the response time was spent waiting for buffer busy waits! So, normally the next step here would be to check:
- Check the type (and location) of the block involved in the contention – and also whether there’s a single very “hot” block involved in this or are there many different “warm” blocks that add up. Note that I didn’t say “block causing contention” here, as block is just a data structure, it doesn’t cause contention – it’s the sessions who lock this block, do.
- Who’s the session holding this lock (pin) on the buffer – and is there a single blocking session causing all this or many different sessions that add up to the problem.
- What are the blocking sessions themselves doing (e.g. are they stuck waiting for something else themselves?)
Let’s use the “traditional” approach first. As I know the SQL ID and this SQL runtime (from the SQL Monitoring report for example), I can query ASH records with my ashtop.sql script (warning, wide output):
SQL> @ash/ashtop session_state,event sql_id='3rtbs9vqukc71' "timestamp'2013-10-05 01:00:00'" "timestamp'2013-10-05 03:00:00'"

%This  SESSION EVENT                                                            TotalSeconds        CPU   User I/O Application Concurrency     Commit Configuration    Cluster       Idle    Network System I/O  Scheduler Administrative   Queueing      Other MIN(SAMPLE_TIME)                                                            MAX(SAMPLE_TIME)
------ ------- ---------------------------------------------------------------- ------------ ---------- ---------- ----------- ----------- ---------- ------------- ---------- ---------- ---------- ---------- ---------- -------------- ---------- ---------- --------------------------------------------------------------------------- ---------------------------------------------------------------------------
  57%  WAITING buffer busy waits                                                       71962          0          0           0       71962          0             0          0          0          0          0          0              0          0          0 05-OCT-13 01.35.09.923 AM                                                   05-OCT-13 02.45.54.106 AM
  35%  ON CPU                                                                          43735      43735          0           0           0          0             0          0          0          0          0          0              0          0          0 05-OCT-13 01.34.55.903 AM                                                   05-OCT-13 02.47.28.232 AM
   6%  WAITING direct path write                                                        6959          0       6959           0           0          0             0          0          0          0          0          0              0          0          0 05-OCT-13 01.35.07.923 AM                                                   05-OCT-13 02.47.21.232 AM
   1%  WAITING external table read                                                      1756          0       1756           0           0          0             0          0          0          0          0          0              0          0          0 05-OCT-13 01.35.02.913 AM                                                   05-OCT-13 02.47.15.222 AM
   0%  WAITING local write wait                                                          350          0        350           0           0          0             0          0          0          0          0          0              0          0          0 05-OCT-13 02.02.40.034 AM                                                   05-OCT-13 02.46.59.202 AM
   0%  WAITING control file parallel write                                               231          0          0           0           0          0             0          0          0          0        231          0              0          0          0 05-OCT-13 01.35.22.953 AM                                                   05-OCT-13 02.47.15.222 AM
   0%  WAITING cell smart file creation                                                  228          0        228           0           0          0             0          0          0          0          0          0              0          0          0 05-OCT-13 01.35.09.923 AM                                                   05-OCT-13 02.47.26.232 AM
   0%  WAITING DFS lock handle                                                           194          0          0           0           0          0             0          0          0          0          0          0              0          0        194 05-OCT-13 01.35.15.933 AM                                                   05-OCT-13 02.47.14.222 AM
   0%  WAITING cell single block physical read                                           146          0        146           0           0          0             0          0          0          0          0          0              0          0          0 05-OCT-13 01.35.12.933 AM                                                   05-OCT-13 02.47.09.212 AM
   0%  WAITING control file sequential read                                               63          0          0           0           0          0             0          0          0          0         63          0              0          0          0 05-OCT-13 01.35.17.953 AM                                                   05-OCT-13 02.46.56.192 AM
   0%  WAITING change tracking file synchronous read                                      57          0          0           0           0          0             0          0          0          0          0          0              0          0         57 05-OCT-13 01.35.26.963 AM                                                   05-OCT-13 02.40.32.677 AM
   0%  WAITING db file single write                                                       48          0         48           0           0          0             0          0          0          0          0          0              0          0          0 05-OCT-13 01.38.21.317 AM                                                   05-OCT-13 02.41.55.794 AM
   0%  WAITING gc current grant 2-way                                                     19          0          0           0           0          0             0         19          0          0          0          0              0          0          0 05-OCT-13 01.35.06.923 AM                                                   05-OCT-13 02.45.46.096 AM
   0%  WAITING kfk: async disk IO                                                         13          0          0           0           0          0             0          0          0          0         13          0              0          0          0 05-OCT-13 01.42.34.791 AM                                                   05-OCT-13 02.38.19.485 AM
   0%  WAITING resmgr:cpu quantum                                                          9          0          0           0           0          0             0          0          0          0          0          9              0          0          0 05-OCT-13 01.36.09.085 AM                                                   05-OCT-13 01.59.08.635 AM
   0%  WAITING enq: CR - block range reuse ckpt                                            7          0          0           0           0          0             0          0          0          0          0          0              0          0          7 05-OCT-13 02.12.42.069 AM                                                   05-OCT-13 02.40.46.687 AM
   0%  WAITING latch: redo allocation                                                      3          0          0           0           0          0             0          0          0          0          0          0              0          0          3 05-OCT-13 02.10.01.807 AM                                                   05-OCT-13 02.10.01.807 AM
   0%  WAITING Disk file operations I/O                                                    2          0          2           0           0          0             0          0          0          0          0          0              0          0          0 05-OCT-13 01.41.13.639 AM                                                   05-OCT-13 01.43.50.951 AM
   0%  WAITING enq: XL - fault extent map                                                  2          0          0           0           0          0             0          0          0          0          0          0              0          0          2 05-OCT-13 01.35.34.983 AM                                                   05-OCT-13 01.35.34.983 AM
   0%  WAITING external table open                                                         2          0          2           0           0          0             0          0          0          0          0          0              0          0          0 05-OCT-13 01.35.02.913 AM                                                   05-OCT-13 01.35.02.913 AM
57% of the DB time was spent waiting for buffer busy waits. So let’s check the P2/P3 to see which block# (in a datafile) and block class# we are dealing with:
SQL> @ash/ashtop session_state,event,p2text,p2,p3text,p3 sql_id='3rtbs9vqukc71' "timestamp'2013-10-05 01:00:00'" "timestamp'2013-10-05 03:00:00'" %This SESSION EVENT P2TEXT P2 P3TEXT P3 TotalSeconds CPU User I/O Application Concurrency Commit Configuration Cluster Idle Network System I/O Scheduler Administrative Queueing Other MIN(SAMPLE_TIME) MAX(SAMPLE_TIME) ------ ------- ---------------------------------------------------------------- ------------------------------ ---------- ------------------------------ ---------- ------------ ---------- ---------- ----------- ----------- ---------- ------------- ---------- ---------- ---------- ---------- ---------- -------------- ---------- ---------- --------------------------------------------------------------------------- --------------------------------------------------------------------------- 57% WAITING buffer busy waits block# 2 class# 13 71962 0 0 0 71962 0 0 0 0 0 0 0 0 0 0 05-OCT-13 01.35.09.923 AM 05-OCT-13 02.45.54.106 AM 31% ON CPU file# 0 size 524288 38495 38495 0 0 0 0 0 0 0 0 0 0 0 0 0 05-OCT-13 01.35.05.923 AM 05-OCT-13 02.47.25.232 AM 1% WAITING external table read file# 0 size 524288 1756 0 1756 0 0 0 0 0 0 0 0 0 0 0 0 05-OCT-13 01.35.02.913 AM 05-OCT-13 02.47.15.222 AM 1% ON CPU block# 2 class# 13 945 945 0 0 0 0 0 0 0 0 0 0 0 0 0 05-OCT-13 01.35.16.943 AM 05-OCT-13 02.45.10.056 AM 0% ON CPU consumer group id 12573 0 353 353 0 0 0 0 0 0 0 0 0 0 0 0 0 05-OCT-13 01.34.56.903 AM 05-OCT-13 01.59.59.739 AM 0% WAITING cell smart file creation 0 0 228 0 228 0 0 0 0 0 0 0 0 0 0 0 0 05-OCT-13 01.35.09.923 AM 05-OCT-13 02.47.26.232 AM 0% WAITING DFS lock handle id1 3 id2 2 193 0 0 0 0 0 0 0 0 0 0 0 0 0 193 05-OCT-13 01.35.15.933 AM 05-OCT-13 02.47.14.222 AM 0% ON CPU file# 41 size 41 118 118 0 0 0 0 0 0 0 0 0 0 0 0 0 05-OCT-13 01.34.56.903 AM 05-OCT-13 01.35.02.913 AM 0% WAITING cell single block physical read diskhash# 4004695794 bytes 8192 85 0 85 0 0 0 0 0 0 0 0 0 0 0 0 05-OCT-13 01.35.12.933 AM 05-OCT-13 02.47.09.212 AM 0% WAITING control file parallel write block# 1 requests 2 81 0 0 0 0 0 0 0 0 0 81 0 0 0 0 05-OCT-13 01.35.22.953 AM 05-OCT-13 02.41.54.794 AM 0% WAITING control file parallel write block# 41 requests 2 74 0 0 0 0 0 0 0 0 0 74 0 0 0 0 05-OCT-13 01.35.31.983 AM 05-OCT-13 02.47.15.222 AM 0% WAITING change tracking file synchronous read blocks 1 0 57 0 0 0 0 0 0 0 0 0 0 0 0 0 57 05-OCT-13 01.35.26.963 AM 05-OCT-13 02.40.32.677 AM 0% WAITING control file parallel write block# 42 requests 2 51 0 0 0 0 0 0 0 0 0 51 0 0 0 0 05-OCT-13 01.35.23.953 AM 05-OCT-13 02.47.10.212 AM 0% WAITING db file single write block# 1 blocks 1 48 0 48 0 0 0 0 0 0 0 0 0 0 0 0 05-OCT-13 01.38.21.317 AM 05-OCT-13 02.41.55.794 AM 0% ON CPU 0 0 31 31 0 0 0 0 0 0 0 0 0 0 0 0 0 05-OCT-13 01.35.19.953 AM 05-OCT-13 02.44.32.006 AM 0% WAITING control file parallel write block# 39 requests 2 21 0 0 0 0 0 0 0 0 0 21 0 0 0 0 05-OCT-13 01.36.35.125 AM 05-OCT-13 02.39.30.575 AM 0% WAITING control file sequential read block# 1 blocks 1 20 0 0 0 0 0 0 0 0 0 20 0 0 0 0 05-OCT-13 01.35.17.953 AM 05-OCT-13 02.46.56.192 AM 0% ON CPU locn 0 0 19 19 0 0 0 0 0 0 0 0 0 0 0 0 0 05-OCT-13 01.35.34.983 AM 05-OCT-13 02.30.34.786 AM 0% ON CPU fileno 0 filetype 2 16 16 0 0 0 0 0 0 0 0 0 0 0 0 0 05-OCT-13 01.36.08.075 AM 05-OCT-13 02.44.26.996 AM 0% WAITING kfk: async disk IO intr 0 timeout 4294967295 13 0 0 0 0 0 0 0 0 0 13 0 0 0 0 05-OCT-13 01.42.34.791 AM 05-OCT-13 02.38.19.485 AM
Buffer busy waits on block #2 of a datafile? Seems familiar … But instead of guessing or dumping the block (to see what type it is) we can just check what the block class# 13 is:
SQL> @bclass 13

CLASS              UNDO_SEGMENT_ID
------------------ ---------------
file header block
So, the block #2 is something called a “file header block”. Actually don’t confuse it with block #1 which is the real datafile header block (as we know it from the concepts guide), the block #2 is actually the LMT tablespace space management bitmap header block (from the P1 value I saw the file# was 16, so I dumped the block with ALTER SYSTEM DUMP DATAFILE 16 BLOCK 2 command):
Start dump data blocks tsn: 21 file#:16 minblk 2 maxblk 2
Block dump from cache:
Dump of buffer cache at level 4 for tsn=21 rdba=2
BH (0x1e1f25718) file#: 16 rdba: 0x00000002 (1024/2) class: 13 ba: 0x1e1876000
  set: 71 pool: 3 bsz: 8192 bsi: 0 sflg: 1 pwc: 2,22
  dbwrid: 2 obj: -1 objn: 1 tsn: 21 afn: 16 hint: f
  hash: [0x24f5a3008,0x24f5a3008] lru: [0x16bf3c188,0x163eee488]
  ckptq: [NULL] fileq: [NULL] objq: [0x173f10230,0x175ece830] objaq: [0x22ee19ba8,0x16df2f2c0]
  st: SCURRENT md: NULL fpin: 'ktfbwh00: ktfbhfmt' tch: 162 le: 0xcefb4af8
  flags: foreground_waiting block_written_once redo_since_read
  LRBA: [0x0.0.0] LSCN: [0x0.0] HSCN: [0xffff.ffffffff] HSUB: [2]
Block dump from disk:
buffer tsn: 21 rdba: 0x00000002 (1024/2)
scn: 0x0001.13988a3a seq: 0x02 flg: 0x04 tail: 0x8a3a1d02
frmt: 0x02 chkval: 0xee04 type: 0x1d=KTFB Bitmapped File Space Header
Hex dump of block: st=0, typ_found=1
Dump of memory from 0x00007F6708C71800 to 0x00007F6708C73800
7F6708C71800 0000A21D 00000002 13988A3A 04020001  [........:.......]
7F6708C71810 0000EE04 00000400 00000008 08CEEE00  [................]
So, the block number 2 is actually the first LMT space bitmap block. Every time you need to manage LMT space (allocate extents, search for space in the file or release extents), you will need to pin the block #2 of the datafile – and everyone else who tries to do the same has to wait.
Now the next question should be – who’s blocking us – who’s holding this block pinned so much then? And what is the blocker itself doing? This is where the ASH wait chains script comes into play – instead of me manually looking up the “blocking_session” column value, I’m just using a CONNECT BY to look up what the blocker itself was doing:
SQL> @ash/ash_wait_chains event2 sql_id='3rtbs9vqukc71' "timestamp'2013-10-05 01:00:00'" "timestamp'2013-10-05 03:00:00'"

-- Display ASH Wait Chain Signatures script v0.2 BETA by Tanel Poder (  )

%This     SECONDS WAIT_CHAIN
------ ---------- ------------------------------------------------------------------------------------------------------------------------------------------------------------------------------------------------------------------------------------------------------------------------------------------------------------
  35%       43735 -> ON CPU
  15%       18531 -> buffer busy waits [file header block]  -> ON CPU
   7%        9266 -> buffer busy waits [file header block]  -> control file parallel write
   7%        8261 -> buffer busy waits [file header block]  -> cell smart file creation
   6%        6959 -> direct path write
   5%        6707 -> buffer busy waits [file header block]  -> DFS lock handle
   4%        4658 -> buffer busy waits [file header block]  -> local write wait
   4%        4610 -> buffer busy waits [file header block]  -> cell single block physical read
   3%        4282 -> buffer busy waits [file header block]  -> local write wait  -> db file parallel write
   2%        2801 -> buffer busy waits [file header block]
   2%        2676 -> buffer busy waits [file header block]  -> ASM file metadata operation
   2%        2092 -> buffer busy waits [file header block]  -> change tracking file synchronous read
   2%        2050 -> buffer busy waits [file header block]  -> control file sequential read
If you follow the arrows, 15% of response time of this SQL was spent waiting for buffer busy waits [on the LMT space header block], while the blocker (we don’t know who yet) was itself on CPU – doing something. There’s 7+7% percent waited on buffer busy waits, while the blocker itself was either waiting for “control file parallel write” or “cell smart file creation” – the offloaded datafile extension wait event.
Let’s see who blocked us (which username and which program):
SQL> @ash/ash_wait_chains username||':'||program2||event2 sql_id='3rtbs9vqukc71' "timestamp'2013-10-05 01:00:00'" "timestamp'2013-10-05 03:00:00'"

-- Display ASH Wait Chain Signatures script v0.2 BETA by Tanel Poder (  )

%This     SECONDS WAIT_CHAIN
------ ---------- ------------------------------------------------------------------------------------------------------------------------------------------------------------------------------------------------------------------------------------------------------------------------------------------------------------
  35%       43732 -> TANEL:(Pnnn) ON CPU
  13%       16908 -> TANEL:(Pnnn) buffer busy waits [file header block]  -> TANEL:(Pnnn) ON CPU
   6%        6959 -> TANEL:(Pnnn) direct path write
   4%        4838 -> TANEL:(Pnnn) buffer busy waits [file header block]  -> SYS:(Wnnn) control file parallel write
   4%        4428 -> TANEL:(Pnnn) buffer busy waits [file header block]  -> TANEL:(Pnnn) control file parallel write
   3%        4166 -> TANEL:(Pnnn) buffer busy waits [file header block]  -> TANEL:(Pnnn) cell smart file creation
   3%        4095 -> TANEL:(Pnnn) buffer busy waits [file header block]  -> SYS:(Wnnn) cell smart file creation
   3%        3607 -> TANEL:(Pnnn) buffer busy waits [file header block]  -> SYS:(Wnnn) DFS lock handle
   3%        3147 -> TANEL:(Pnnn) buffer busy waits [file header block]  -> TANEL:(Pnnn) local write wait
   2%        3117 -> TANEL:(Pnnn) buffer busy waits [file header block]  -> TANEL:(Pnnn) local write wait  -> SYS:(DBWn) db file parallel write
   2%        3100 -> TANEL:(Pnnn) buffer busy waits [file header block]  -> TANEL:(Pnnn) DFS lock handle
   2%        2801 -> TANEL:(Pnnn) buffer busy waits [file header block]
   2%        2764 -> TANEL:(Pnnn) buffer busy waits [file header block]  -> TANEL:(Pnnn) cell single block physical read
   2%        2676 -> TANEL:(Pnnn) buffer busy waits [file header block]  -> SYS:(Wnnn) ASM file metadata operation
   1%        1825 -> TANEL:(Pnnn) buffer busy waits [file header block]  -> SYS:(Wnnn) cell single block physical read
Now we also see who was blocking us? In the line with 13% response time, we were blocked by another TANEL user running a PX slave (I’m replacing digits to “n” in the background processes, like P000, for collapsing them all into a single line). In line #4 above with th 4% of wait time, TANEL’s PX slave was blocked by SYS running a Wnnn process – it’s one of the workers for space management stuff like asynchronous datafile pre-extension. So, looks like the datafile extension bottleneck has a role to play in this! I could pre-extend the datafile in advance myself (it’s a bigfile tablespace) when aniticipating a big data load that has to happen fast – but the first thing I would do is check whether the tablespace is an LMT tablespace with UNIFORM extent sizing policy _and _the minimum extent size is big enough for my data load. In other words, your biggest fact tables with heavy data loads should reside in an LMT tablespace with UNIFORM extent size of multiple MB (I’ve used between 32MB and 256MB extent size). The AUTOALLOCATE doesn’t really save you much – as with autoallocate there’s a LMT space management bitmap bit per each 64kB chunk of the file – there’s much more overhead when searching and allocating a big extent consisting of many small LMT “chunks” vs a big extent which consists of only a single big LMT chunk.
I will come back to the topic of buffer busy waits on block #2 in a following post – this post aims to show that you can pretty much use any ASH column you like to more details about who was doing what in the entire wait chain.
And another topic for the future would be the wait events which do not populate blocking session info proprely (depending on version, most latches and mutexes for example). The manual approach would still be needed there – although with mutexes is possible to extract the (exclusive) blocking SID from the wait event’s PARAMETER2 value. Maybe in ash_wait_chains v0.3 :-)
