If you haven’t read them – here are the previous articles in Oracle memory troubleshooting series: Part 1, Part 2, Part 3.
Let’s say you have noticed that one of your Oracle processes is consuming a lot of private memory. The V$PROCESS has PGA_USED_MEM / PGA_ALLOC_MEM columns for this. Note that this view will tell you what Oracle thinks it’s using – how much of allocated/freed bytes it has kept track of. While this doesn’t usually tell you the true memory usage of a process, as other non-Oracle-heap allocation routines and the OS libraries may allocate (and leak) memory of their own, it’s a good starting point and usually enough.
Then, the V$PROCESS_MEMORY view would allow you to see a basic breakdown of that process’es memory usage – is it for SQL, PL/SQL, Java, unused (Freeable) or for “Other” reasons. You can use either the smem.sql or pmem.sql scripts for this (report v$process_memory for a SID or OS PID):
SQL> @smem 198
Display session 198 memory usage from v$process_memory....

       SID        PID    SERIAL# CATEGORY         ALLOCATED       USED MAX_ALLOCATED
---------- ---------- ---------- --------------- ---------- ---------- -------------
       198         43         17 Freeable           1572864          0
       198         43         17 Other              5481102                  5481102
       198         43         17 PL/SQL                2024        136          2024
       198         43         17 SQL              117805736  117717824     118834536
From the above output we see that this session has allocated over 100MB of private memory for “SQL” reasons. This normally means SQL workareas, so we can break this down further by querying V$SQL_WORKAREA_ACTIVE that shows us all currently in-use cursor workareas in the instance. I’m using a script wrka.sql for convenience – and listing only my SID-s workareas:
SQL> @wrka sid=198
Show Active workarea memory usage for where sid=198...

   INST_ID        SID  QCINST_ID      QCSID SQL_ID        OPERATION_TYPE                  PLAN_LINE POLICY                   ACTIVE_SEC ACTUAL_MEM_USED MAX_MEM_USED WORK_AREA_SIZE NUMBER_PASSES TEMPSEG_SIZE TABLESPACE
---------- ---------- ---------- ---------- ------------- ------------------------------ ---------- ------------------------ ---------- --------------- ------------ -------------- ------------- ------------ ------------------------------
         1        198                       ff8v9qhv21pm5 SORT (v2)                               1 AUTO                           14.6        64741376    104879104       97623040             0   2253389824 TEMP
         1        198                       ff8v9qhv21pm5 HASH-JOIN                               6 AUTO                           14.8         1370112      1370112        2387968             0
         1        198                       ff8v9qhv21pm5 BUFFER                                 25 AUTO                           14.8        11272192     11272192       11272192             0
The ACTUAL_MEM_USED column above shows the currently used memory by this workarea (that happens to be a SORT (v2) operation in that cursor’s execution plan line #1). It was only about 64MB at the time I got to query this view, but the MAX_MEM_USED shows it was about 100MB at its peak. This can happen due to multipass operations where the merge phase may use less memory than the sort phase or once the sorting completed and the rowsource was ready to start sending sorted rows back, not that much memory would have been needed anymore for just buffering the blocks read from TEMP (the sort_area_size vs sort_area_retained_size thing from past).
For completeness, I also have a script called wrkasum.sql that summarizes the workarea memory usage of all sessions in an instance (so if you’re not interested in a single session, but rather a summary of which operation types tend to consume most memory etc) you can use that:
SQL> @wrkasum
Top allocation reason by PGA memory usage

OPERATION_TYPE      POLICY      ACTUAL_PGA_MB ALLOWED_PGA_MB    TEMP_MB NUM_PASSES     NUM_QC NUM_SESSIONS
------------------- ----------- ------------- -------------- ---------- ---------- ---------- ------------
SORT (v2)           AUTO                   58            100       1525          0          1            1
BUFFER              AUTO                   11             11                     0          1            1
HASH-JOIN           AUTO                    1              2                     0          1            1
You may want to modify the script to change the GROUP BY to SQL_ID you want to list the top workarea-memory consuming SQL statement across the whole instance (or any other column of interest – like QC_INST_ID/QCSID).
But what about the following example:
SQL> @pmem 27199
Display process memory usage for SPID 27199...

       SID SPID                            PID    SERIAL# CATEGORY         ALLOCATED       USED MAX_ALLOCATED     CON_ID
---------- ------------------------ ---------- ---------- --------------- ---------- ---------- ------------- ----------
      1516 27199                           120        198 Freeable            786432          0                        0
      1516 27199                           120        198 Other            842807461                842807461          0
      1516 27199                           120        198 PL/SQL              421064      77296        572344          0
      1516 27199                           120        198 SQL                2203848      50168       2348040          0
Most of the memory (over 800MB) is consumed by category “Other”?! Not that helpful, huh? V$SQL_WORKAREA_ACTIVE didn’t show anything either as it deals only with SQL workareas and not all the other possible reasons why an Oracle process might allocate memory.
So we need a way to drill down into the Other category and see which allocation reasons have taken the most of this memory. Historically this was only doable with a PGA/UGA memory heapdump and by aggregating the resulting dumpfile. You have to use oradebug to get the target process to dump its own private memory breakdown as it’s private memory and other processes can not just read it directly. I have written about it in Part 1 of the Oracle memory troubleshooting series.
_Update: an alternative to ORADEBUG is to use ALTER SESSION SET EVENTS ‘immediate trace name pga_detail_get level N’ where N is the Oracle PID of the process. _
However starting from Oracle 10.2 you can get similar detailed breakdown info by querying V$PROCESS_MEMORY_DETAIL, no need for post-processing tracefiles! However when you just query it, the view does not return any rows:
SQL> SELECT * FROM v$process_memory_detail;

no rows selected
Again this is for the abovementioned reasons – your current process can not just read the contents of some other process’es private memory – the OS ensures that. You will have to ask that target process to populate the V$PROCESS_MEMORY_DETAIL with its memory allocation breakdown. You can do this by using the ORADEBUG DUMP PGA_DETAIL_GET command:
SQL> ORADEBUG SETMYPID
Statement processed.
SQL> ORADEBUG DUMP PGA_DETAIL_GET 49
Statement processed.
The number 49 above is the Oracle PID (v$process.pid) of the target process I want to examine. The oradebug PGA_DETAIL_GET command will not immediately make the target process to report its usage – it will merely set a flag somewhere and the target process itself checks it when it is active. In other words, if the target process is idle or sleeping for a long time (due to some lock for example), then it won’t populate the V$ view with required data. In my test environment, the V$PROCESS_MEMORY_DETAIL got populated only after I ran another dummy command in the target session. This shouldn’t be an issue if you are examining a process that’s actively doing something (and not idle/sleeping for a long time).
The output below is from another dummy demo session that wasn’t using much of memory:
SQL> SELECT * FROM v$process_memory_detail ORDER BY pid, bytes DESC;

       PID    SERIAL# CATEGORY        NAME                       HEAP_NAME            BYTES ALLOCATION_COUNT HEAP_DES PARENT_H
---------- ---------- --------------- -------------------------- --------------- ---------- ---------------- -------- --------
        49          5 Other           permanent memory           pga heap            162004               19 11B602C0 00
        49          5 SQL             QERHJ Bit vector           QERHJ hash-joi      131168                8 F691EF4C F68F6F7C
        49          5 Other           kxsFrame4kPage             session heap         57736               14 F68E7134 11B64780
        49          5 SQL             free memory                QERHJ hash-joi       54272                5 F691EF4C F68F6F7C
        49          5 Other           free memory                pga heap             41924                8 11B602C0 00
        49          5 Other           miscellaneous                                   39980              123 00       00
        49          5 Other           Fixed Uga                  Fixed UGA heap       36584                1 F6AA44B0 11B602C0
        49          5 Other           permanent memory           top call heap        32804                2 11B64660 00
        49          5 Other           permanent memory           session heap         32224                2 F68E7134 11B64780
        49          5 Other           free memory                top call heap        31692                1 11B64660 00
        49          5 Other           kgh stack                  pga heap             17012                1 11B602C0 00
        49          5 Other           kxsFrame16kPage            session heap         16412                1 F68E7134 11B64780
        49          5 Other           dbgeInitProcessCtx:InvCtx  diag pga             15096                2 F75A8630 11B602C0
...
The BYTES column shows the sum of memory allocated from private memory heap HEAP_NAME for the reason shown in NAME column. If you want to know the average allocation (chunk) size in the heap, divide BYTES by ALLOCATION_COUNT.
For example, the top PGA memory user in that process is an allocation called “permanent memory”, 162004 bytes taken straight from the top-level “pga-heap”. It probably contains all kinds of low-level runtime allocations that the process needs for its own purposes. It may be possible to drill down into the subheaps inside that allocation with the Oracle memory top-5 subheap dumping I have written about before.
The 2nd biggest memory user is in category SQL – “QERHJ Bit vector” allocation, 131168 bytes allocated in 8 chunks of ~16kB each (on average). QERHJ should mean Query Execution Row-source Hash-Join and the hash join bit vector is a hash join optimization (somewhat like a bloom filter on hash buckets) – Jonathan Lewis has written about this in his CBO book.
I do have a couple of scripts which automate running the ORAEDBUG command, waiting for a second so that the target process would have a chance to publish its data in the V$PROCESS_MEMORY_DETAIL and then query it. Check out smem_detail.sql and pmem_detail.sql.
Now, let’s look into a real example from a problem case – a stress test environment on Oracle 12c:
SQL> @smem 1516
Display session 1516 memory usage from v$process_memory....

       SID        PID    SERIAL# CATEGORY         ALLOCATED       USED MAX_ALLOCATED     CON_ID
---------- ---------- ---------- --------------- ---------- ---------- ------------- ----------
      1516        120        198 Freeable            786432          0                        0
      1516        120        198 Other            844733773                844733773          0
      1516        120        198 PL/SQL              421064      77296        572344          0
      1516        120        198 SQL                 277536      45904       2348040          0
The Other memory usage of a session has grown to over 800MB!
Let’s drill down deeper. The script warns that it’s experimental and asks you to press enter to continue as it’s using ORADEBUG. I haven’t seen any problems with it, but use it at your own risk (and stay away from critical background processes on production systems)!
SQL> @smem_detail 1516

WARNING! About to run an undocumented ORADEBUG command
for getting heap details.
This script is EXPERIMENTAL, use at your own risk!

Press ENTER to continue, or CTRL+C to cancel

PL/SQL procedure successfully completed.

STATUS
----------
COMPLETE

If the status above is not COMPLETE then you need to wait
for the target process to do some work and re-run the
v$process_memory_detail query in this script manually
(or just take a heapdump level 29 to get heap breakdown
in a tracefile)

       SID CATEGORY        NAME                       HEAP_NAME            BYTES ALLOCATION_COUNT
---------- --------------- -------------------------- --------------- ---------- ----------------
      1516 Other           permanent memory           qmxlu subheap    779697376           203700
      1516 Other           free memory                qmxlu subheap     25960784           202133
      1516 Other           XVM Storage                XVM subheap of     5708032               51
      1516 Other           free memory                session heap       2722944              598
      1516 Other           permanent memory           pga heap            681992               36
      1516 Other           qmushtCreate               qmtmInit            590256                9
      1516 Other           free memory                top uga heap        449024              208
      1516 Other           qmtmltAlloc                qmtmInit            389680             1777
      1516 Other           permanent memory           kolarsCreateCt      316960               15
      1516 Other           free memory                pga heap            306416               17
      1516 Other           miscellaneous                                  297120              105
      1516 Other           permanent memory           qmxtgCreateBuf      279536               73
      1516 Other           free memory                koh dur heap d      239312              134
      1516 Other           kxsFrame4kPage             session heap        232512               56
      1516 Other           permanent memory           qmcxdDecodeIni      228672               21
      1516 Other           permanent memory           qmxtigcp:heap       215936              730
      1516 Other           permanent memory           session heap        189472               28
      1516 Other           free memory                lpxHeap subhea      182760               32
      1516 Other           kfioRqTracer               pga heap            131104                1
      1516 Other           free memory                top call heap       129312                4
      1516 PL/SQL          recursive addr reg file    koh-kghu sessi      110592               10
      1516 Other           free memory                callheap            109856                4
      1516 Other           koh-kghu session heap      session heap         88272               36
      1516 Other           Fixed Uga                  pga heap             72144                1
      1516 PL/SQL          PL/SQL STACK               PLS PGA hp           68256                4
...
Well, there you go – the power of measuring & profiling. Most of that big memory usage comes from something called qmxlu subheap. Now, while this name is cryptic and we don’t know what it means – we are already half-way there, we at least know what to focus on now. We can ignore all the other hundreds of cryptic memory allocations in the output and just try to figure out what “qmxlu subheap” is. A quick MOS search might just tell it and if there are known bugs related to this memory leak, you might just find what’s affecting you right away (as Oracle support analysts may have pasted some symptoms, patch info and workarounds into the bug note):
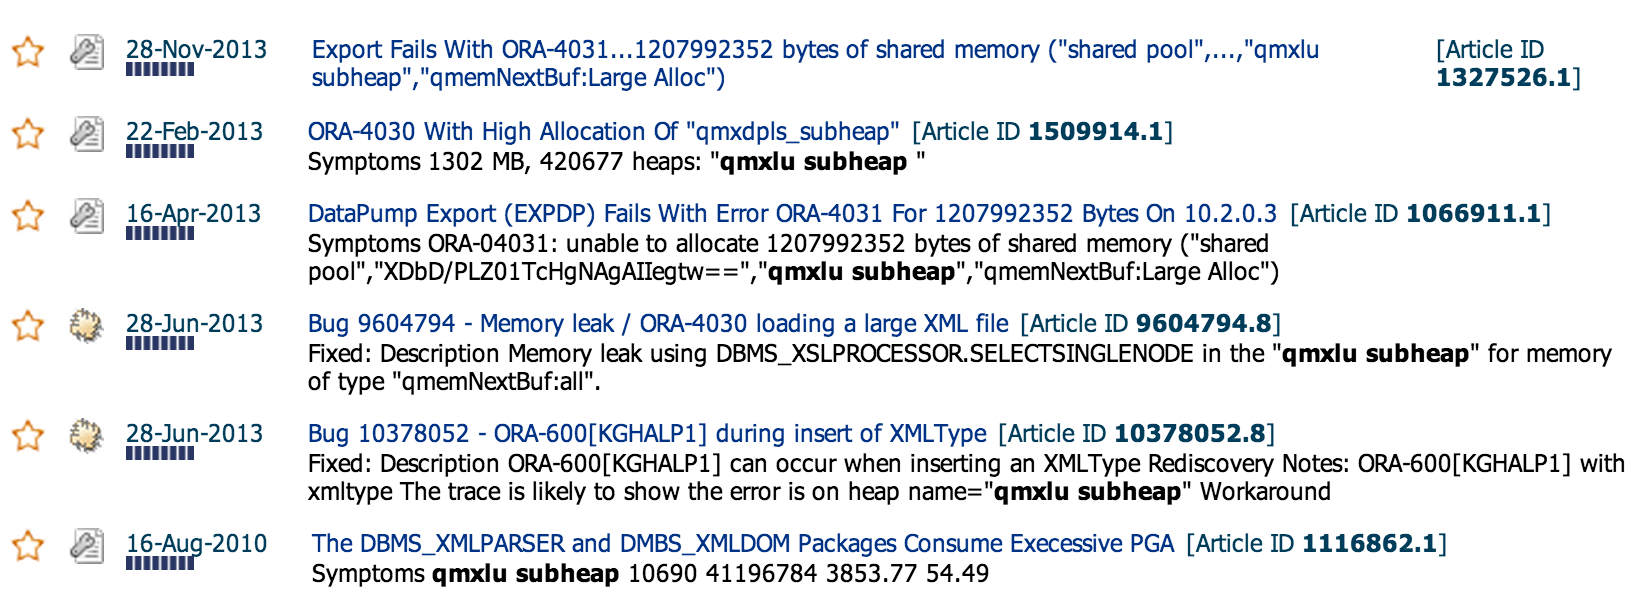
Indeed, there are plenty of results in MOS and when browsing through them to find one matching our symptoms and environment the closest, I looked into this: ORA-4030 With High Allocation Of “qmxdpls_subheap” (Doc ID 1509914.1). It came up in the search as the support analyst had pasted a recursive subheap dump containing our symptom – “qmxlu subheap” there:
Summary of subheaps at depth 2
5277 MB total:
 5277 MB commented, 128 KB permanent
 174 KB free (110 KB in empty extents),
   2803 MB, 1542119496 heaps:   "               "
   1302 MB, 420677 heaps:   "qmxlu subheap  "
    408 MB, 10096248 chunks:  "qmxdplsArrayGetNI1        " 2 KB free held
    385 MB, 10096248 chunks:  "qmxdplsArrayNI0           " 2 KB free held
In this note, the reference bug had been closed as “not a bug” and hinted that it may be an application issue (an application “object” leak) instead of an internal memory leak that causes this memory usage growth.
Cause:
The cause of this problem has been identified in:
unpublished Bug:8918821 – MEMORY LEAK IN DBMS_XMLPARSER IN QMXDPLS_SUBHEAP
closed as “not a bug”. The problem is caused by the fact that the XML document is created with XMLDOM.CREATEELEMENT, but after creation XMLDOM.FREEDOCUMENT is not called. This causes the XML used heaps to remain allocated. Every new call to XMLDOM.CREATEELEMENT will then allocate a new heap, causing process memory to grow over time, and hence cause the ORA-4030 error to occur in the end.
Solution:
To implement a solution for this issue, use XMLDOM.FREEDOCUMENT to explicitly free any explicitly or implictly created XML document, so the memory associated with that document can be released for reuse.
And indeed, in our case it turned out that it was an application issue – the application did not free the XMLDOM documents after use, slowly accumulating more and more open document memory structures, using more memory and also more CPU time (as, judging by the ALLOCATION_COUNT figure in smem_detail output above, the internal array used for managing the open document structures had grown to 203700). Once the application object leak issue was fixed, the performance and memory usage problem went away.
Summary:
****V$PROCESS_MEMORY_DETAIL allows you to conveniently dig deeper into process PGA memory usage. The alternative is to use Oracle heapdumps. A few more useful comments about it are in an old Oracle-L post.
Normally my process memory troubleshooting & drilldown sequence goes like that (usually only steps 1-2 are enough, 3-4 are rarely needed):
- v$process / v$process_memory / top / ps
- v$sql_workarea_active
- v$process_memory_detail or heapdump_analyzer
- pmap -x at OS level
#1,2,3 above can show you “session” level memory usage (assuming that you are using dedicated servers with 1-1 relationship between a session and a process) and #4 can show you a different view into the real process memory usage from the OS perspective.
Even though you may see cryptic allocation reason names in the output, if reason X causes 95% of your problem, you’ll need to focus on finding out what X means and don’t need to waste time on anything else. If there’s an Oracle bug involved, a MOS search by top memory consumer names would likely point you to the relevant bug right away.
Oracle troubleshooting is fun!
